




Key Takeaways
- Franchise performance metrics should include operational KPIs alongside sales and financial results. Task completion, audit scores, temperature log compliance, training completion, and staff turnover can reveal execution problems before they appear in the P&L.
- HQ needs these metrics once the network grows beyond direct observation. If leaders cannot regularly see every location, consistent data becomes the way to spot where standards are slipping.
- Compare locations using rates and trends rather than raw counts. A larger store naturally produces more tasks, employees, readings, and opportunities for misses.
- Benchmark like-for-like locations and separate local execution problems from patterns appearing across multiple sites before deciding what needs fixing.
At three locations, a founder can still know which manager is struggling, which store skips closing checks, and where standards are drifting.
At 30 locations, though, that visibility disappears.
Franchise performance metrics replace some of that lost line of sight. Sales and P&L still show whether the business is performing financially, but operational KPIs show whether each location is executing the processes needed to produce those results.
This guide covers the five indicators HQ should track across every location, how to calculate them, and how to compare sites without creating misleading rankings.
What Are Franchise Performance Metrics?
Franchise performance metrics are measurable indicators HQ and franchise operators use to understand how individual locations and the wider network are performing.
They can include financial outcomes such as sales, margins, labor costs, and royalties. They can also measure the operating conditions behind those outcomes, including whether employees complete critical tasks, pass audits, maintain food-safety records, finish required training, and stay with the business.
That second group becomes increasingly important as a network scales. When leaders can no longer observe every location themselves, they need consistent signals to answer questions such as:
- Are brand standards being followed?
- Which locations are getting better or worse?
- Are the same problems appearing across several sites?
- Is one location struggling with execution while the rest of the system performs normally?
Strong franchise performance measurement thus combines financial results with operational leading indicators. For operators reaching that stage of growth, this guide to managing a multi-unit franchise explains how systems and visibility need to change as the network expands.
Why Sales Alone Doesn’t Give You the Complete Picture
Sales, food cost, and the P&L are essential, but they largely tell HQ what has already happened.
If service standards deteriorate for weeks, training lapses, critical tasks get skipped, or food-safety checks become inconsistent, revenue or margin can eventually expose the problem. By then, employees and guests may already have experienced it.
Operational KPIs give HQ an earlier signal. You have probably outgrown the founder’s line of sight when:
- The founder or senior operator can no longer visit every location regularly.
- A second region or state opens.
- A franchisee takes over a location without ever working directly alongside the founder.
- An audit result surprises HQ.
- The same SOP produces noticeably different outcomes between stores.
- Regional managers start relying on individual store updates to understand what is happening.
At that point, informal oversight no longer scales.
Multi-unit operators who catch problems earlier tend to review shorter-cycle indicators instead of waiting for monthly financial reporting. In a recent article, operator Monica Harrigill explains the network-level diagnostic aptly: “If multiple units show the same pattern, it’s usually system wide.”
Recognizing this distinction helps HQ decide whether it has a local execution issue or a process that needs fixing across the network.
| Lagging: What Already Happened | Leading: What Signals an Emerging Problem |
|---|---|
| Same-store sales | Task completion rate on critical tasks |
| Food and labor cost percentage | Temperature log compliance |
| Guest review scores | Brand-standard and food-safety audit scores |
| Royalty revenue | Training completion for each role |
| Unit closures | 90-day staff turnover |
The idea isn’t to replace financial reporting. It is to add the operating signals that explain why performance may change next.
Once a network reaches this stage, operational visibility across locations becomes part of the management system rather than something leaders can maintain through personal presence alone.
The 5 Operational KPIs HQ Should Track at Every Location
The five core operational KPIs are task completion, audit performance, temperature log compliance, training completion, and 90-day staff turnover. Together, they show whether locations are executing the standards that eventually influence sales, cost, compliance, and customer experience.
| KPI | How to Calculate | What It Predicts |
|---|---|---|
| Task completion rate | Critical tasks completed on time ÷ critical tasks scheduled × 100 | Execution discipline and missed operating routines |
| Audit score and repeat failures | Points earned ÷ points available × 100; track repeat findings separately | Brand-standard consistency and whether corrective actions stick |
| Temperature log compliance | Required checks completed correctly and on time ÷ checks scheduled × 100 | Food-safety discipline and monitoring gaps |
| Training completion by role | Required training completed by deadline ÷ assigned training × 100 | Role readiness and compliance exposure |
| 90-day staff turnover | Hires leaving within 90 days ÷ hires in the completed cohort × 100 | Onboarding quality, local management, and workforce stability |
The targets below are practical starting points for an internal scorecard, not industry benchmarks. Adjust them to your brand, risk profile, and operating model.
1. Task Completion Rate
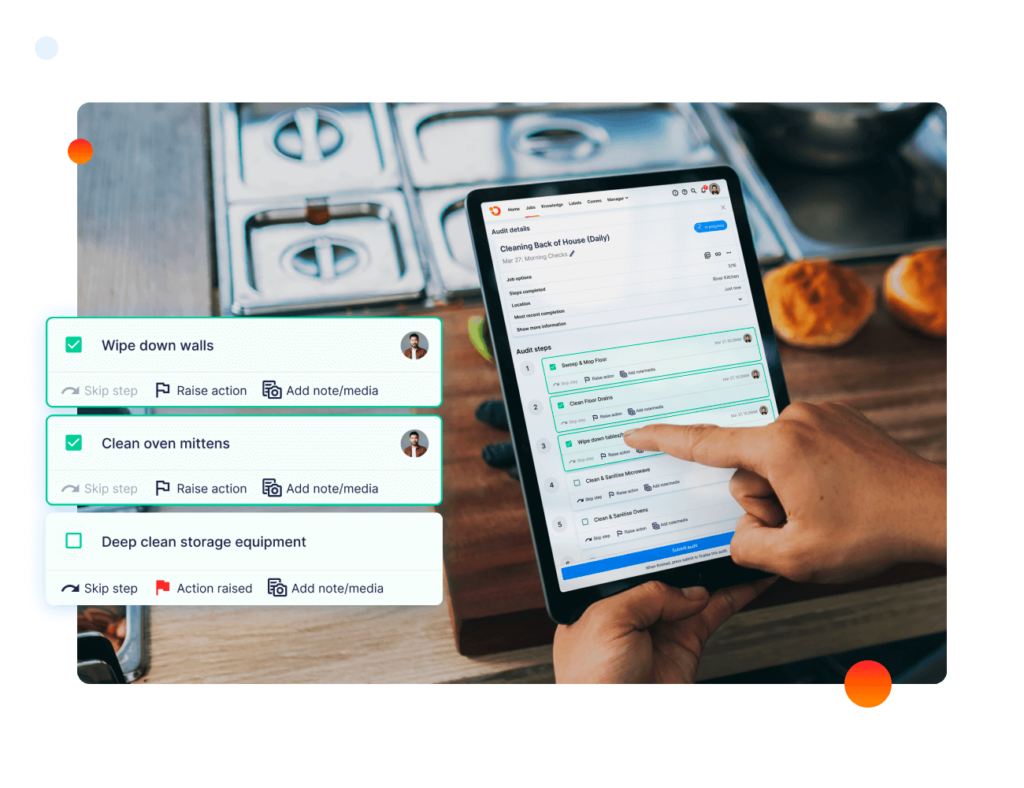
Task completion rate shows whether the critical work HQ expects is actually getting done on time.
Formula: Critical tasks completed on time ÷ critical tasks scheduled × 100
A reasonable starting target is 95% or higher for critical recurring tasks, with 100% expected for mandatory safety or compliance work.
Watch the trend as well as the percentage. A location falling from 98% to 93% over several weeks deserves attention even if it still looks respectable beside weaker sites.
Completion can fall because of unclear ownership, unrealistic scheduling, poor staffing, weak manager follow-up, or tasks that no longer match the actual workflow.
A digital task management system can calculate completion automatically from the work teams already perform, rather than asking managers to submit another weekly report.
2. Audit Scores and Repeat Failures
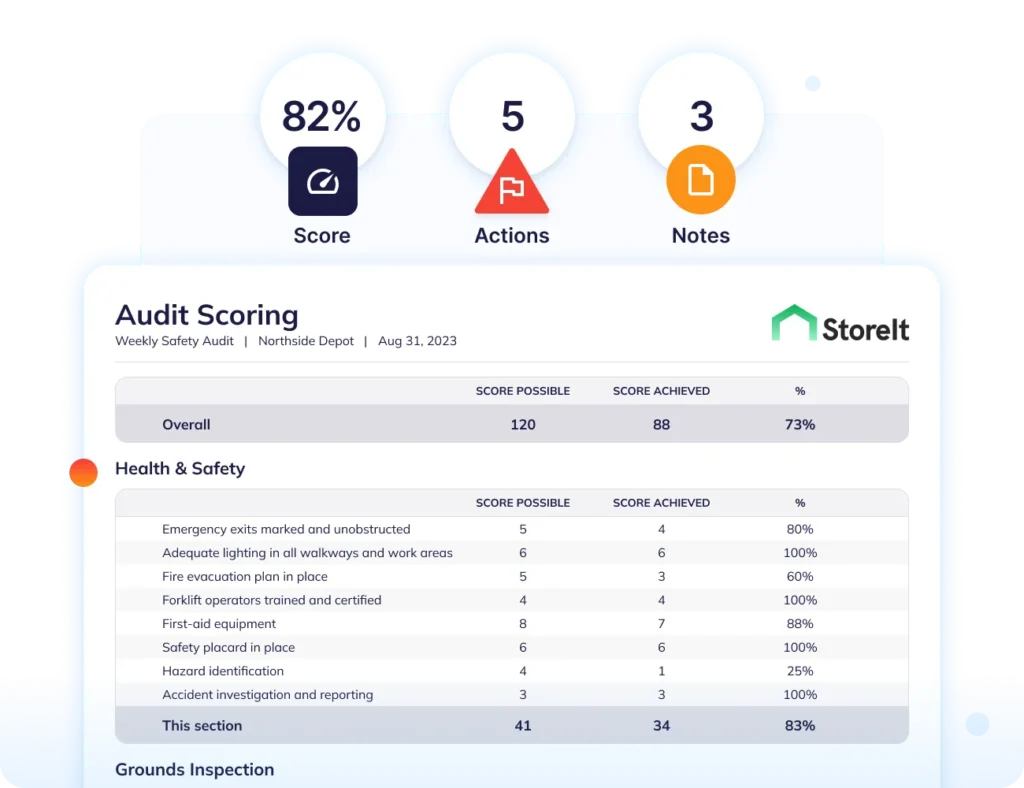
Audit scores show whether locations consistently meet brand, food-safety, quality, and compliance standards.
A simple score is: Points earned ÷ points available × 100
For a starting internal target, HQ might use 90% or higher, but the scoring model and threshold should reflect the brand’s own risks.
Don’t stop at the headline percentage. Track repeat-failure rate as well:
Repeat findings ÷ total findings × 100
A site scoring 92% while repeatedly failing the same high-risk food-safety item can be more concerning than a site at 88% with several one-off low-risk findings.
Standardized franchise audits help HQ compare sites using the same questions and scoring rules, while digital inspections and audits can surface recurring issues without manually consolidating audit files.
3. Temperature Log Compliance
For food-service franchises, temperature log compliance shows whether required food-safety checks happen when they should.
Formula:
Required temperature checks completed correctly and on time ÷ checks scheduled × 100
Use 100% completion as the starting expectation for mandatory checks.
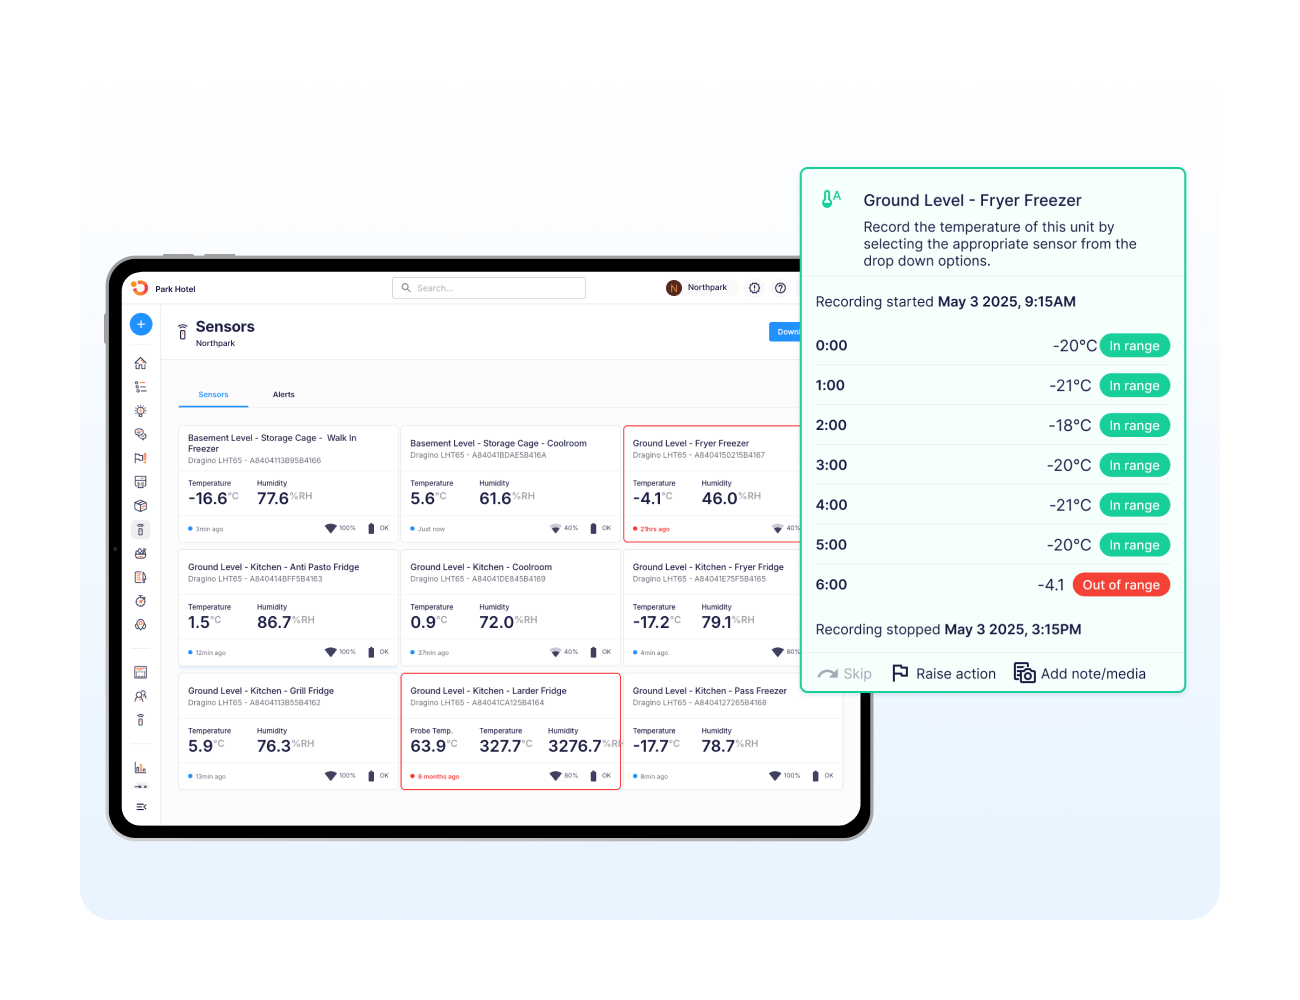
But completion alone isn’t enough. A location can log every reading and still record repeated unsafe temperatures. HQ should review both log compliance and the number of out-of-range readings or corrective actions.
FDA data found cold holding out of compliance in 62% of fast-food and 80% of full-service restaurant observations. The takeaway for HQ is straightforward: temperature control is common enough as a failure that it should be visible at network level.
Operandio’s automated temperature monitoring can capture readings and exceptions without adding manual reporting work for managers.
💡 Pro Tip: The best operational KPI is often the one employees generate simply by doing the work. Tasks, audit results, sensor readings, and training records should feed reporting automatically instead of being re-entered into a separate scorecard.
4. Training Completion for Each Role
A network-level training percentage can hide local risk if it combines employees with different requirements.
Track completion by role and location:
Required role training completed by deadline ÷ required assignments × 100
For mandatory role, safety, or compliance training, the starting expectation should be 100% by the due date.
A lower rate can signal poor onboarding, manager follow-up, scheduling problems, or training that is difficult for frontline employees to access.
Completion also needs context. Finishing a course proves the training was delivered, not that the employee can actually perform the skill correctly.
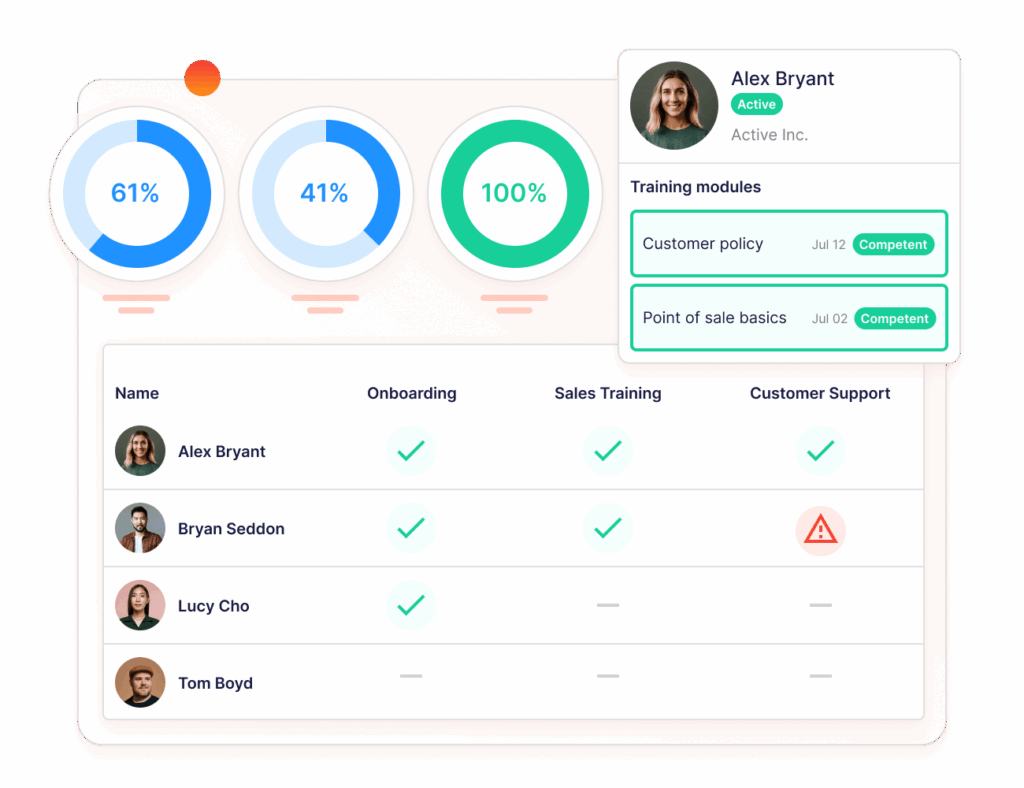
HQ should therefore monitor completion alongside certifications or practical assessments where required. A centralized learning management system like Operandio can track completed and overdue training across locations.
5. Staff Turnover
Turnover is a useful location KPI because persistent early employee loss can point to weak onboarding, local leadership, scheduling, workload, or workplace conditions.
For new hires, calculate:
Employees leaving within 90 days ÷ employees in the completed new-hire cohort × 100
Don’t set one universal turnover target across every location. Start by comparing each site against its own rolling baseline and then against similar locations.
The labor environment also matters. BLS data shows accommodation and food services had an average monthly total separations rate of 5.5% in 2025, compared with 3.6% across total private industry.
The so-what for HQ isn’t making 5.5% the target. It is that high workforce churn makes early-tenure turnover worth monitoring as an operating signal.
Use HR or payroll data for the calculation, then combine it with operational signals such as training, audits, and employee performance trends to investigate why one site is losing people faster than comparable locations.
How to Compare All Your Franchise Locations Fairly
Compare rates, not raw counts. Check each location against its own trend before ranking it against the network, then compare it only with similar sites. This prevents a large, busy store from looking worse simply because it has more employees, tasks, or readings.
| Unfair Comparison | Why It Misleads | Fair Alternative |
|---|---|---|
| Number of missed tasks | Larger sites usually have more scheduled work | Missed or completed tasks as a percentage of tasks scheduled |
| Ranking every site immediately | A rank can hide whether a site is improving or deteriorating | Review its own 8-12 week trend first |
| Comparing every store format together | Drive-throughs, inline stores, and kiosks operate differently | Group locations into like-for-like cohorts |
| Comparing inconsistent audit scores | Different forms or auditors can change the result | Use one audit form, scoring model, and calibrated auditors |
| Ranking from one observation | A small sample can overstate one good or bad result | Set a minimum amount of data before a score enters rankings |
1. Compare Rates, Not Counts
Give every number a denominator.
Compare completed tasks against tasks scheduled, temperature checks against readings required, and training completion against assignments due.
This lets HQ compare a high-volume restaurant with hundreds of weekly checks against a smaller site without penalizing the larger location simply because it has more opportunities to miss something.
The same principle applies outside restaurants: compare the rate of execution, not the size of the operation.
2. Check Each Location’s Own Trend First
Before asking whether a store ranks 18th out of 30, ask whether it is getting better or worse.
An 8-12 week trend is a practical starting view for many recurring operational KPIs. A location that remains below the network average but improves steadily may need a different response from a top-ranked location whose performance is falling quickly.
HQ should use rankings to find differences between sites, but trends help explain whether those differences are stable, improving, or deteriorating.
3. Compare Like With Like
Build cohorts around factors that materially change how a location operates. For restaurants, that can include:
- Drive-through vs. inline vs. kiosk
- Similar transaction or volume bands
- Store age
- Region or operating environment
Report newly opened locations separately while they stabilize. Six months is a reasonable starting point, not a universal rule.
Comparing mature high-volume drive-through restaurants with new kiosks creates a league table, but not necessarily a useful benchmark.
4. Standardize How the Metric Is Measured
Every location should be measured using the same definitions.
For audits, that means one core form, the same scoring rules, and auditors calibrated to interpret failures consistently. Otherwise, part of the score reflects who conducted the audit.
The same applies to tasks, training, and temperature checks. Define what counts as on time, complete, or compliant before comparing locations.
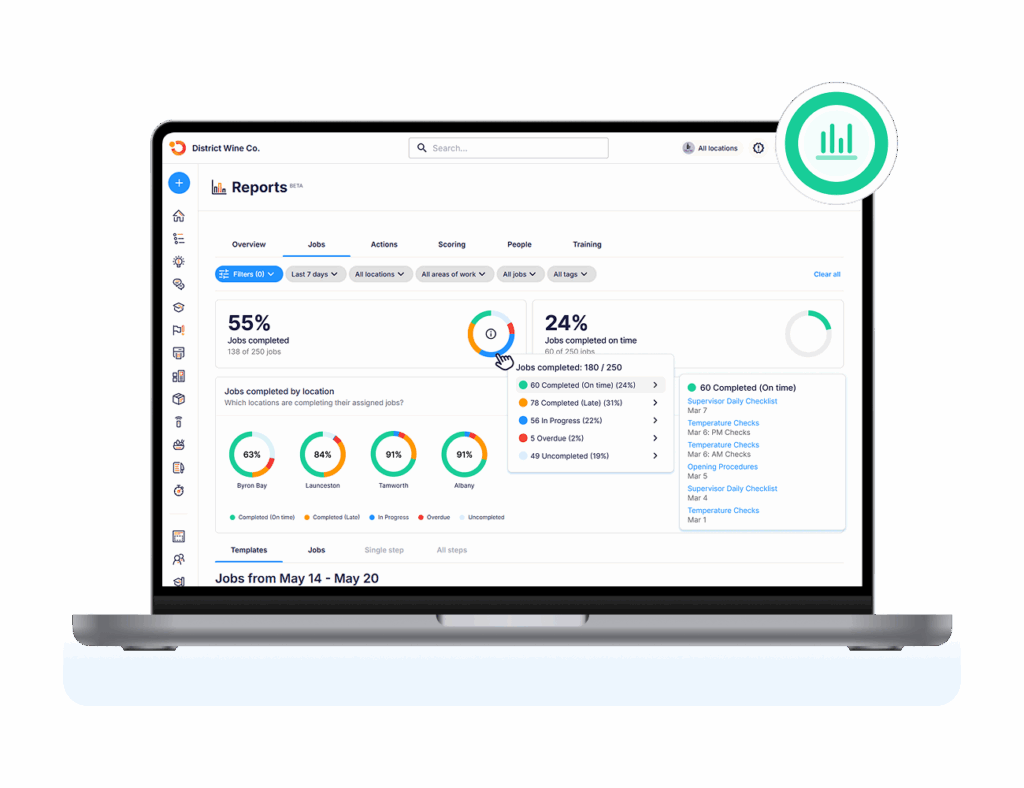
Operandio’s cross-location reporting can compare sites, regions, and concepts while role-based views let franchisees see their own locations and HQ see the wider network.
5. Require Enough Data Before You Rank a Site
Don’t let one inspection, one week, or one new-hire departure decide a location’s standing.
Define the minimum amount of data required before each KPI contributes to a ranking. The appropriate sample will differ by metric.
For example, a monthly task-completion rate may contain hundreds of observations, while audit performance might be based on only a few visits.
When several comparable locations show the same deterioration, investigate the system itself. If one site stands alone, the first place to look is local execution.
Build a Location Scorecard HQ and Franchisees Both Trust
A scorecard combines the five KPIs into one network view, but the weighting should reflect the risks of your business. Here is an illustrative starting model:
| KPI | Starting Weight | Why |
|---|---|---|
| Task completion rate | 25% | Broad signal of whether required daily work is being executed |
| Audit score and repeat failures | 25% | Shows adherence to brand, quality, and compliance standards |
| Temperature log compliance | 20% | Tracks a high-risk food-safety control in restaurant operations |
| Training completion by role | 15% | Shows whether employees have received required role knowledge |
| 90-day staff turnover | 15% | Flags onboarding, management, or workforce-stability problems |
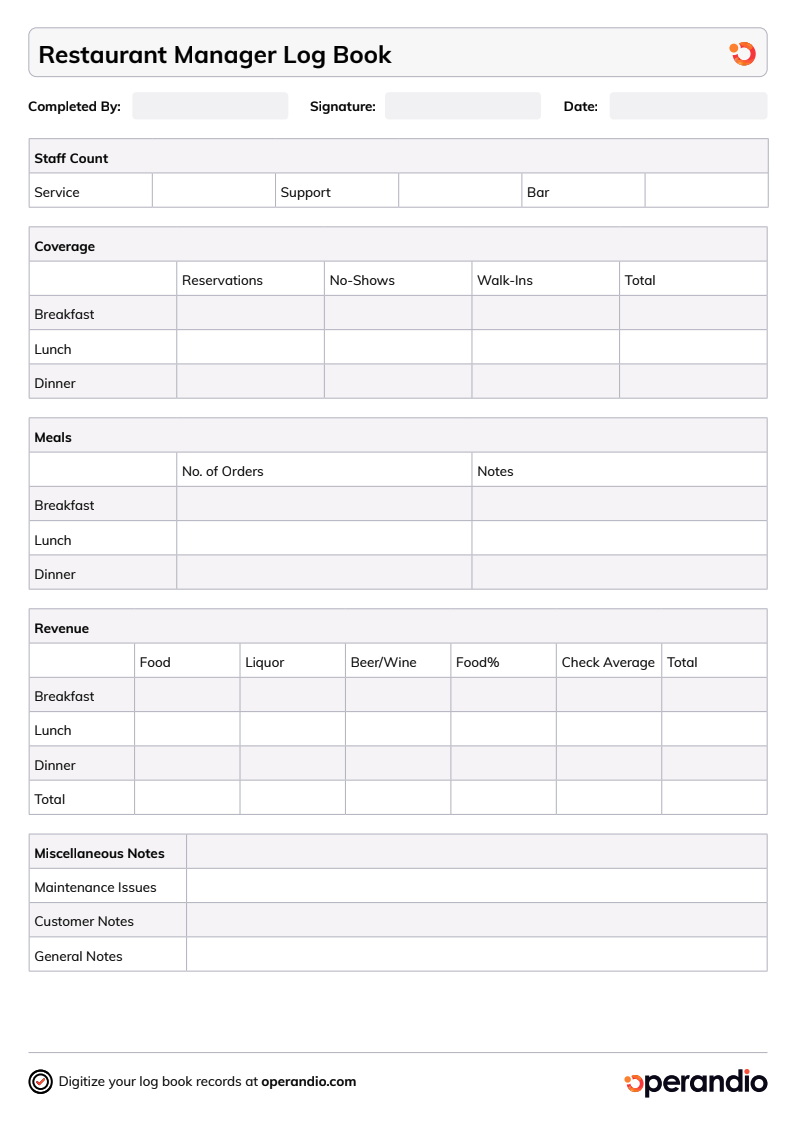
Pair your scorecard with Operandio’s restaurant manager log book template to capture local context such as staffing, maintenance, and operating issues that can help explain why a KPI moved.
Track Every Location’s Operational KPIs in One Place With Operandio
Operational reporting works best when the data comes from the work itself.
Operandio captures task completion, audit performance, temperature checks, and training progress as teams operate, then gives HQ a network view across locations, regions, and brands. Workforce data from other systems can also be combined through integrations and BI tools.
Super Chix uses Operandio across 60+ U.S. locations, with district managers using brand-wide rankings and audit histories to identify where stores need coaching.
“Being able to see the data remotely is very helpful. It gives our managers a lot more time to do their tasks instead of micromanaging the team,” says Lance Nebeker, Assistant Director of Operations at Super Chix
If your network has grown beyond direct line of sight, book a demo to see how Operandio can support multi-location performance tracking.
FAQs
What are the most important KPIs for a franchise?
Start with financial results plus operational KPIs such as task completion, audits, training, compliance, and workforce stability.
How often should HQ review location KPIs?
It depends. Review fast-moving operational KPIs daily or weekly and roll them into a broader location scorecard monthly.
Should franchisees see other locations’ scores?
Sometimes. Benchmarking can help, but access should fit the brand’s governance model and avoid misleading comparisons between unlike locations.
What is the difference between franchise performance metrics and franchise development metrics?
Performance metrics track existing locations. Development metrics typically track franchise sales, openings, pipeline growth, and expansion of the network.
How do you measure franchise performance without visiting every store?
Use standardized digital tasks, audits, training, sensors, workforce data, and cross-location reporting to monitor execution remotely.
Should every franchise location have the same KPI targets?
Not always. Core standards can stay consistent, while targets may need adjustment for format, risk, maturity, volume, or operating model.
What is franchise benchmarking?
Franchise benchmarking compares location performance against its own history and appropriate peer locations to identify gaps, trends, and improvement opportunities.
What should HQ do when several locations miss the same KPI?
Investigate the system. The shared issue may sit in the process, training, tools, staffing model, or brand standard rather than one local team.