
- Platform
- Features
 Franchise & Multi-Unit ManagementCentralize oversight and streamline growth across your entire multi location network
 Learning ManagementTrain, verify, and reward your workforce with mobile-first education
 Operations ExecutionStreamlined operations ensuring brand standards, accountability and efficiency
 Asset ManagementOptimize equipment uptime through proactive maintenance and smart tracking
 Digital Food SafetyAutomate compliance and monitor quality with real-time digital precision
 Health & Safety Management (EHS)Mitigate workplace risks and streamline digital incident reporting and investigations
- Platform Essentials
 Powerful ReportingAlign leadership with role-based dashboards and deeper analytics
 Operandio IntelligenceAutomate content, analyze trends, and provide instant answers
 IntegrationsUnify your enterprise tech stack with real-time data
 IoT PlatformDetect anomalies and automate workflows with intelligent sensors
 Mobile & Shared Tablet AppsSecurely empower frontline teams with fast, offline-capable access
- Footer


 Not sure what you need?
Book in a call with the team
- Features
- Solutions
- By Industry
 RestaurantsQSR, fast food and multi-unit restaurants
 Hotels & ResortsHotels, resorts and extended stay hotels
 ChildcareEarly education, childcare, daycare and preschool
 EntertainmentTheme parks, family entertainment centers and play centers
 Fitness Centers & LeisureFitness centers, golf clubs, gyms and sports facilities
 RetailBig-box retailers, franchise stores and supermarkets
- By Use Case
- Operational ExcellenceStreamlined operations ensuring brand standards, accountability and efficiency
- Learning & DevelopmentTrain, verify, and reward your workforce with mobile-first education
- Franchise & Multi-Unit ManagementCentralize oversight and streamline growth across your entire multi location network
- Food Safety ComplianceAutomate compliance and monitor quality with real-time digital precision
- Asset Management & MaintenanceOptimize equipment uptime through proactive maintenance and smart tracking
- Health & Safety Management (EHS)Mitigate workplace risks and streamline digital incident reporting and investigations
- By Industry
- Resources
- Platform
- Features
- Franchise & Multi-Unit ManagementCentralize oversight and streamline growth across your entire multi location network
- Learning ManagementTrain, verify, and reward your workforce with mobile-first education
- Operations ExecutionStreamlined operations ensuring brand standards, accountability and efficiency
- Asset ManagementOptimize equipment uptime through proactive maintenance and smart tracking
- Digital Food SafetyAutomate compliance and monitor quality with real-time digital precision
- Health & Safety Management (EHS)Mitigate workplace risks and streamline digital incident reporting and investigations
- Platform Essentials
- Powerful ReportingAlign leadership with role-based dashboards and deeper analytics
- Operandio IntelligenceAutomate content, analyze trends, and provide instant answers
- IntegrationsUnify your enterprise tech stack with real-time data
- IoT PlatformDetect anomalies and automate workflows with intelligent sensors
- Mobile & Shared Tablet AppsSecurely empower frontline teams with fast, offline-capable access
- Footer
- Not sure what you need?
Book in a call with the team
- Features
- Solutions
- By Industry
- RestaurantsQSR, fast food and multi-unit restaurants
- Hotels & ResortsHotels, resorts and extended stay hotels
- ChildcareEarly education, childcare, daycare and preschool
- EntertainmentTheme parks, family entertainment centers and play centers
- Fitness Centers & LeisureFitness centers, golf clubs, gyms and sports facilities
- RetailBig-box retailers, franchise stores and supermarkets
- By Use Case
- Operational ExcellenceStreamlined operations ensuring brand standards, accountability and efficiency
- Learning & DevelopmentTrain, verify, and reward your workforce with mobile-first education
- Franchise & Multi-Unit ManagementCentralize oversight and streamline growth across your entire multi location network
- Food Safety ComplianceAutomate compliance and monitor quality with real-time digital precision
- Asset Management & MaintenanceOptimize equipment uptime through proactive maintenance and smart tracking
- Health & Safety Management (EHS)Mitigate workplace risks and streamline digital incident reporting and investigations
- By Industry
- Resources
Top 8 Restaurant Analytics Software & How to Choose (2026)
Key Takeaways
- Operandio is best for multi-location restaurant groups that want real-time visibility into operational execution, including tasks, audits, training, incidents, safety, and compliance across locations.
- Restaurant365 is stronger for financial and back-office analytics, while MarginEdge specializes in food cost, purchasing, recipe margins, and controllable P&L.
- 7shifts is best for labor and workforce analytics, while Nory combines AI forecasting with live labor, sales, food cost, and prime-cost intelligence.
- Tenzo works well as a cross-system restaurant business intelligence layer, Toast suits operators wanting POS-native sales reporting, and Crunchtime is built for large multi-unit groups combining operational data across an enterprise network.
Restaurant data is rarely the problem. The harder part is bringing the right data together and turning it into decisions while there is still time to act.
The best restaurant analytics software depends on what you need to improve. Some platforms focus on sales, labor, food cost, or financial performance. Others show whether locations are completing work, meeting standards, and resolving operational issues.
Below, we compare eight restaurant analytics platforms by their strongest use case, standout capability, and current starting price.
8 Best Restaurant Analytics Software: A Quick Overview
| Name | Best For | Standout Feature | Price Starting Point |
|---|---|---|---|
| Operandio | Real-time operational performance tracking | Cross-location reporting across tasks, audits, training, safety, incidents, and compliance | Custom |
| Restaurant365 | Financial and back-office analytics | Restaurant-specific financial reporting and cross-location P&L visibility | $489/location/month, billed annually |
| MarginEdge | Food-cost and purchasing analytics | Daily controllable P&L and actual-vs-theoretical food-cost analysis | $350/location/month |
| 7shifts | Labor and workforce analytics | Sales and labor reporting with restaurant-specific forecasting | Free; paid plans from $39.99/location/month, billed annually |
| Nory | AI forecasting and prime-cost intelligence | Live labor, sales, food-cost, and demand forecasting across locations | Pricing available on request |
| Tenzo | Cross-system restaurant business intelligence | Brings POS, labor, inventory, reservations, reviews, and other restaurant data into one reporting layer | From $75/location/month |
| Toast | POS-native sales analytics | Real-time sales, menu, and restaurant performance reporting inside the Toast ecosystem | POS from $69/month |
| Crunchtime | Enterprise multi-unit operational intelligence | Connects sales, labor, inventory, tasks, and audit data across large restaurant networks | Pricing available on request |
1. Operandio: Best Restaurant Analytics Software for Real-Time Performance Tracking
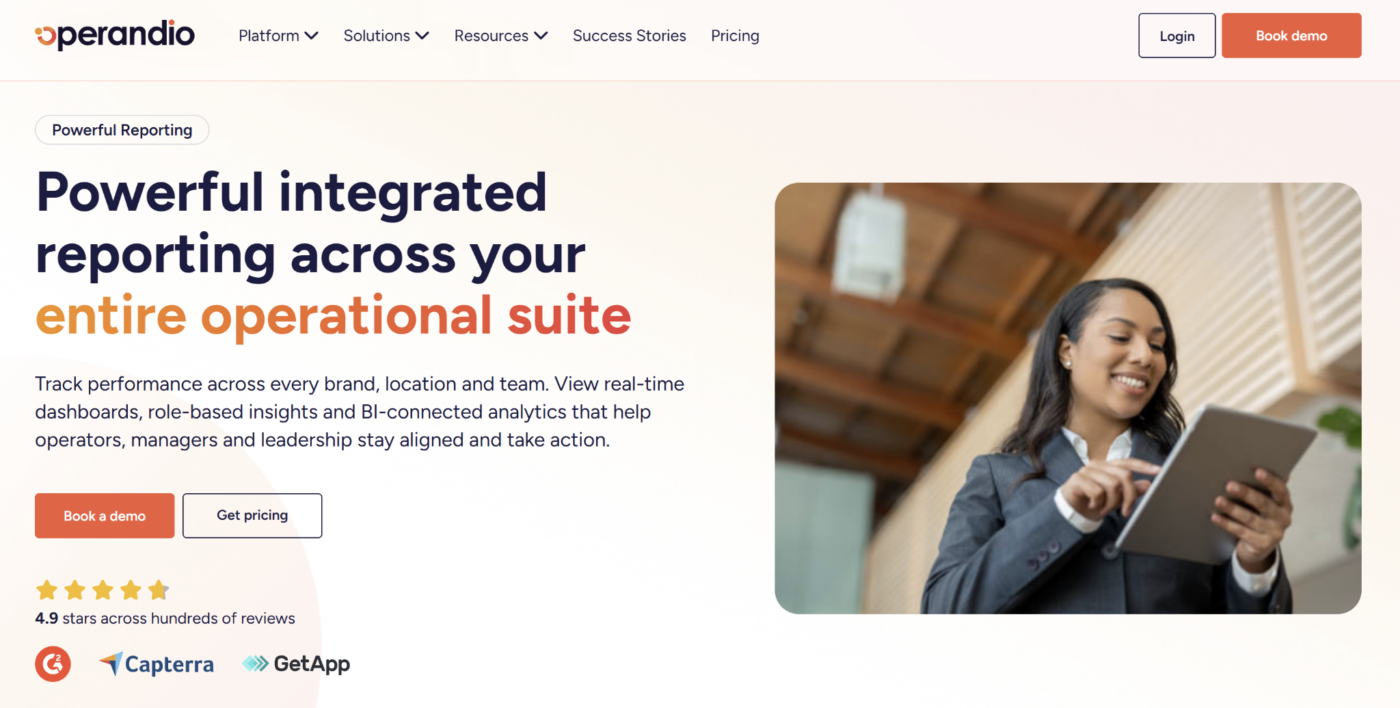
Operandio is an AI-powered operations platform for franchise and multi-unit businesses. Its restaurant analytics focus on how locations are executing, rather than primarily analyzing transactions or accounting data.
Head office can track tasks, audits, training, incidents, safety, assets, and compliance across locations, then drill into the sites or trends that need attention.
Key Features
Operandio collects operational data from the same workflows restaurant teams use every day. That gives operators a live view of whether standards are being followed instead of waiting for managers to compile separate reports.
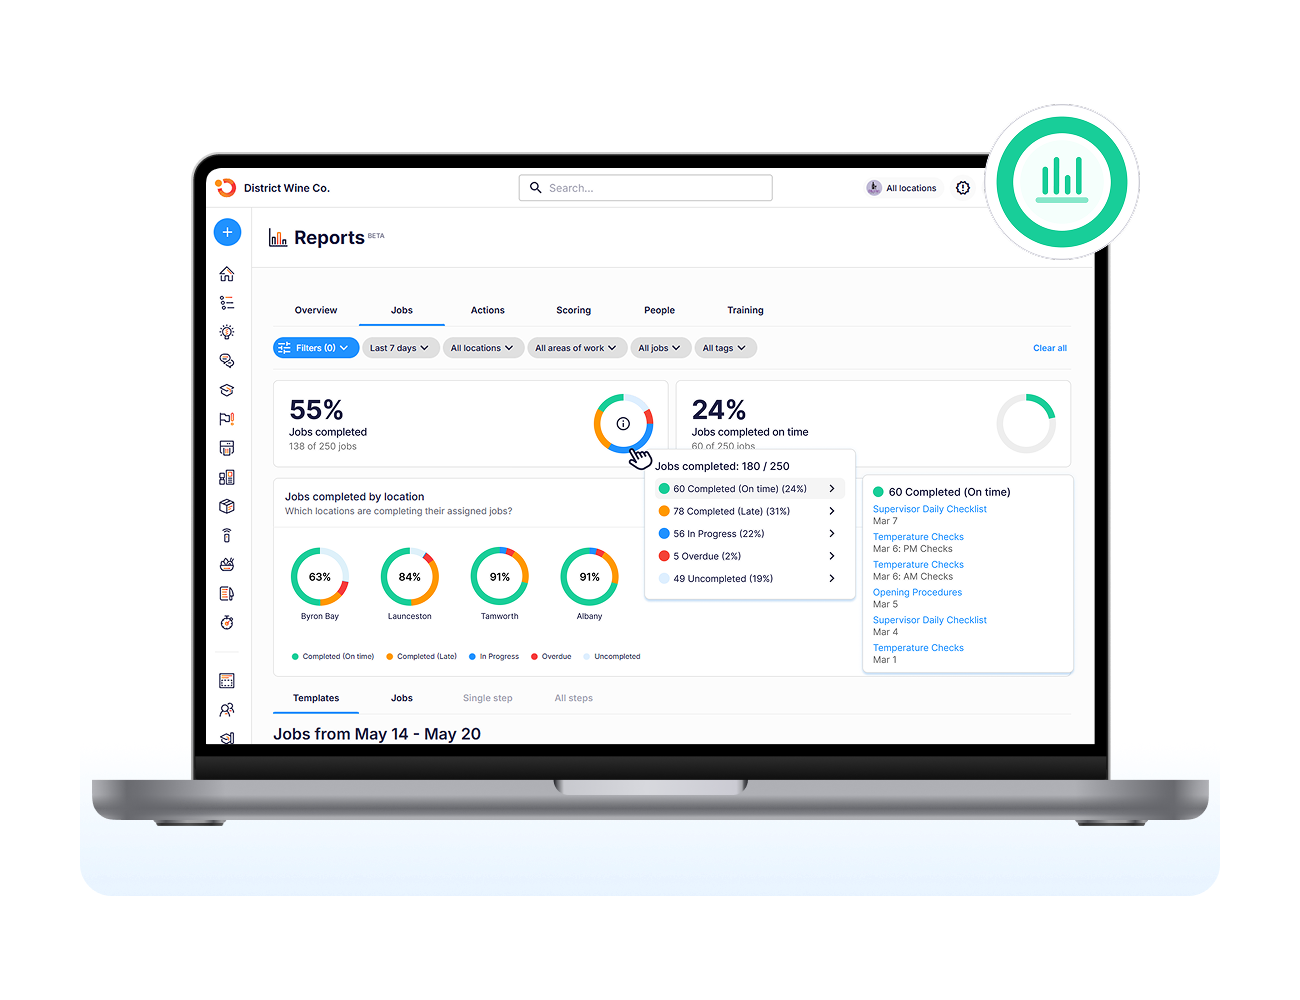
Cross-Location Performance Dashboards
Operandio’s operational reporting brings performance across brands, concepts, regions, business units, and individual locations into one reporting layer.
Operators can compare areas such as:
- Training completion
- Task and checklist execution
- Audit performance
- Safety
- Incidents
- Asset management
- Compliance
This makes the platform particularly useful for multi-unit restaurant groups that want to identify where operational execution differs between locations.
Instead of receiving individual spreadsheets or relying on location managers to summarize performance, head office can see where standards are slipping and focus follow-up on the locations that need it.
Role-Based Reports and Operational Trend Analysis
Not every restaurant manager needs the same data. Operandio provides role-based reporting so:
- Location managers see their own site
- Area managers can review the locations in their territory
- Head office can compare network-wide performance
Teams can also save reporting views for operations, safety, HR, training, or leadership.
Trend analysis helps operators identify recurring gaps rather than looking at individual failures in isolation. For example, a regional manager could compare inspection and audit performance between restaurants, identify a location repeatedly missing a standard, then investigate the process behind the trend.
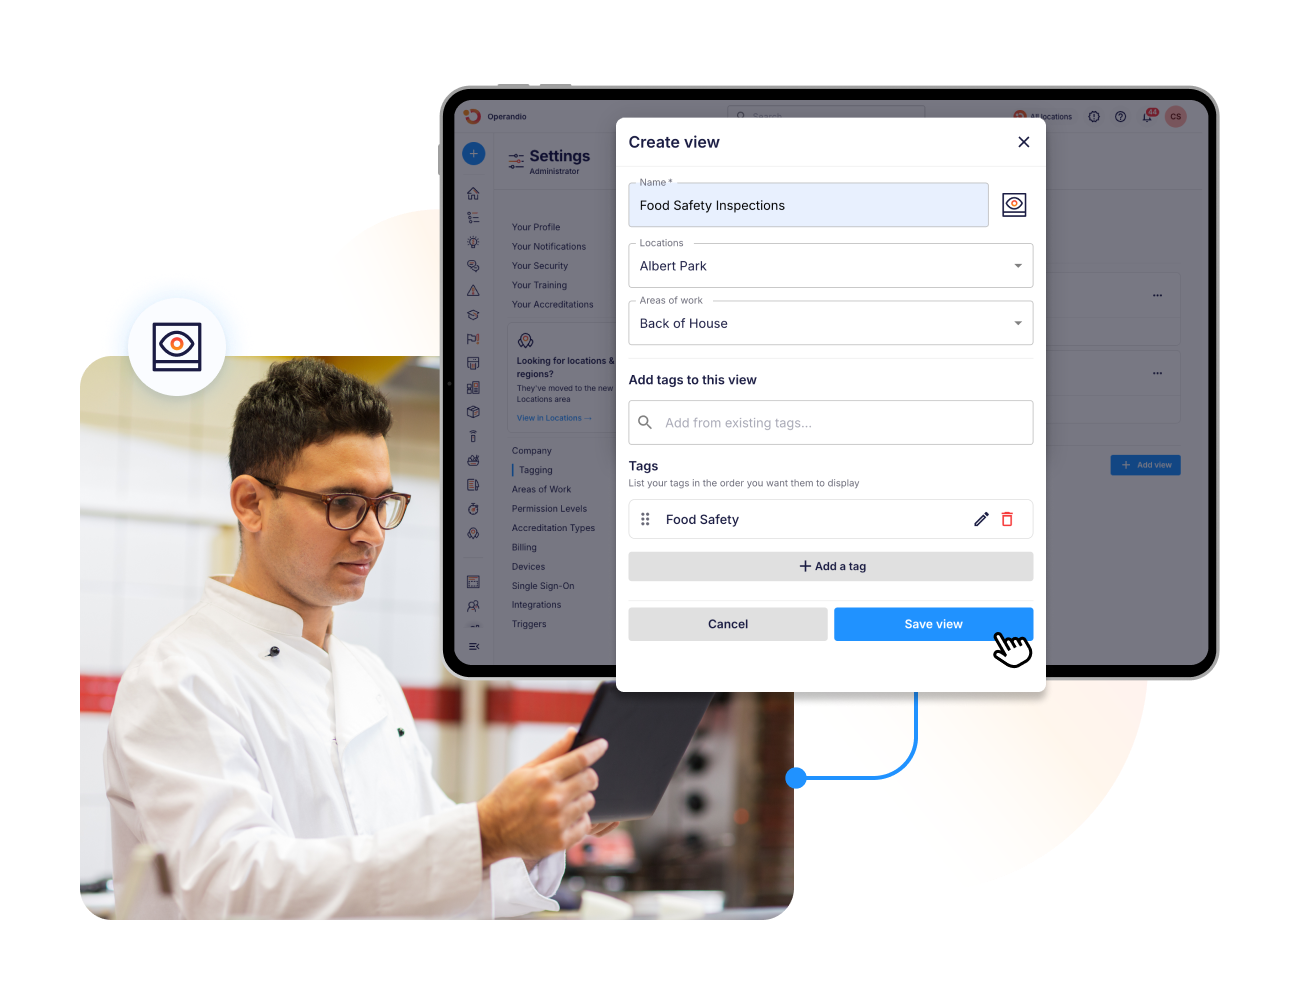
This gives each management level enough information to act without filling every dashboard with network-wide data they do not need.
BI Integrations and Exportable Reporting
Operandio does not need to replace the restaurant’s POS, finance, or existing business intelligence software. The platform can connect operational data to Power BI, Tableau, or another BI environment, allowing teams to combine frontline execution data with sales, financial, or HR information.
That distinction is useful for restaurant groups with an established technology stack. POS software might show a decline in sales, for example, while Operandio can contribute data around task completion, training, audits, incidents, or compliance that helps operators understand what was happening operationally at the same location.
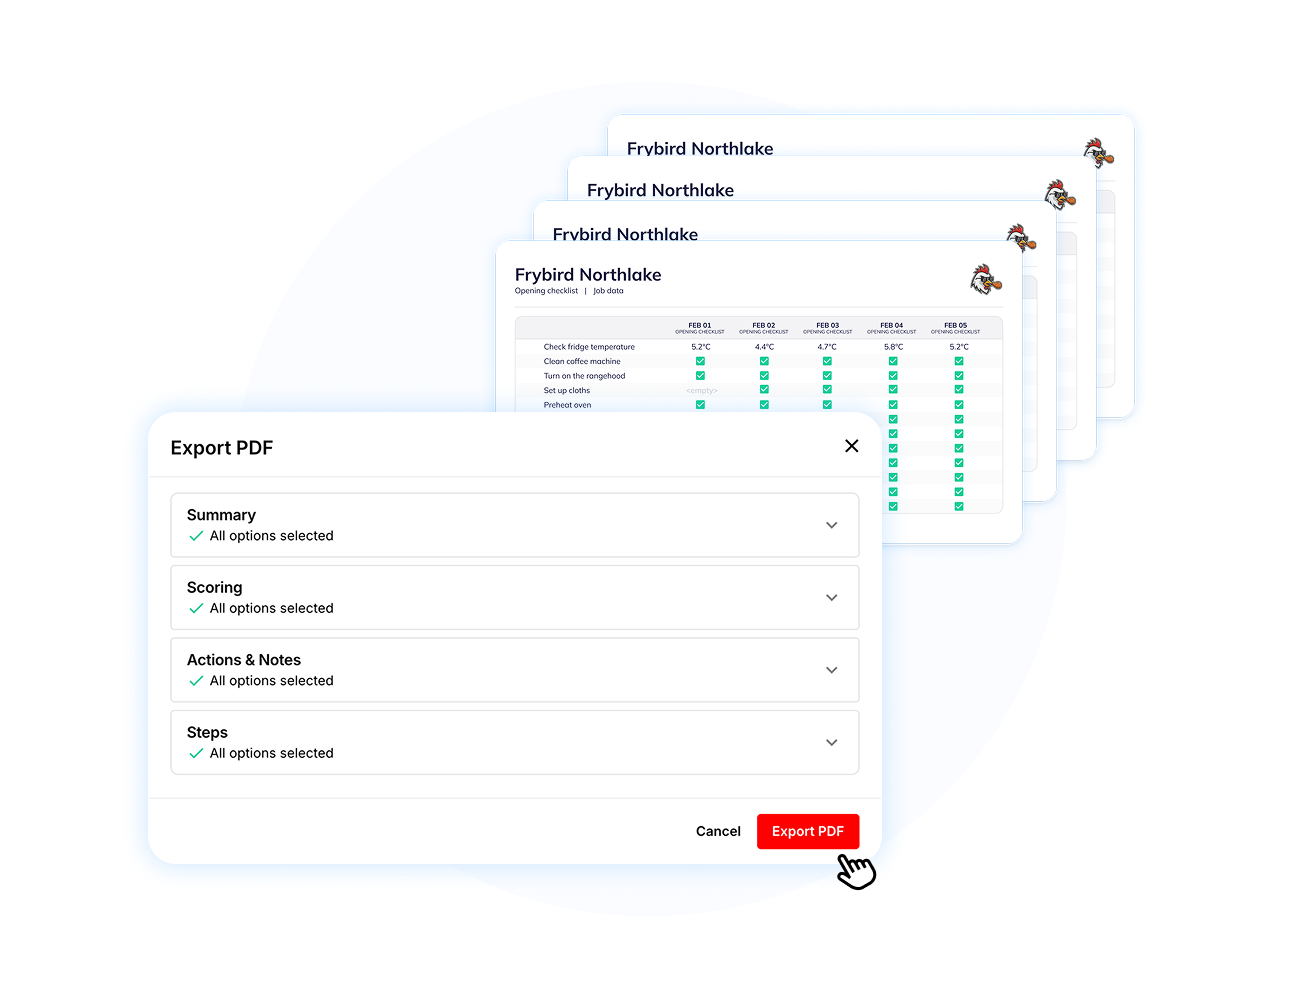
Reports can also be exported to PDF or spreadsheet formats for leadership meetings, franchise reviews, and compliance audits.
Pricing
| Plan | Pricing |
|---|---|
| All tiers | Custom |
Operandio offers modular pricing based on business size, number of locations or users, and the modules selected.
Where Operandio Shines
- Shows operational data that POS reporting misses: Operandio tracks how restaurants execute tasks, audits, training, safety, incidents, and compliance, complementing sales and financial analytics rather than duplicating them.
- Strong visibility across multiple locations: Restaurant groups can compare sites, regions, concepts, and brands from one reporting layer while giving each management level the appropriate view.
- Fits into a broader analytics stack: Power BI and Tableau integrations let operators combine Operandio’s operational data with sales, finance, HR, or other business information.
Did you know? Abacus Dining Group moved from scattered spreadsheets and paper records to Operandio’s centralized operational reporting across five restaurant locations, and it saved its verifiers at least one hour during onsite visits.
Where Operandio Falls Short
- Not a replacement for POS or accounting analytics: Restaurants that only want item-level sales, transaction, P&L, or general-ledger reporting should look at platforms such as Toast, which Operandio integrates with.
- More platform than basic single-site reporting requires: A small independent restaurant that only needs simple sales dashboards may not need Operandio’s broader multi-location operations, compliance, training, and reporting stack.
Customer Reviews
“Operandio has transformed our franchise operations by replacing paper systems with a seamless, automated platform that ensures consistency, enhances communication, and simplifies compliance across 70+ locations,” says Kris K., State Manager, Cold Rock Ice Creamery.
“If you haven’t incorporated Operandio into your operations, you’re overlooking a valuable tool. The reporting access has been a game-changer for our verifiers, saving them at least an hour during onsite visits.” says Mauro O., Head of Operations, Abacus Dining Group.
Who Operandio Is Best For
- Multi-location restaurant groups: Operators that need to compare execution, compliance, training, audits, and other frontline performance across restaurants.
- Franchise and regional operations teams: Head office, area managers, and franchise leaders that need different levels of visibility into location performance. Operandio’s multi-unit operations platform is designed around this network model.
- Restaurants that already have POS and finance analytics: Groups that want an operational data layer to complement sales and accounting systems rather than replace them.
- Restaurant teams managing standards and compliance: Businesses that need analytics connected directly to the frontline workflows generating the data.
Ready to try Operandio? Hit us up to get a custom quote based on your business requirements.
2. Restaurant365: Best for Financial and Back-Office Analytics
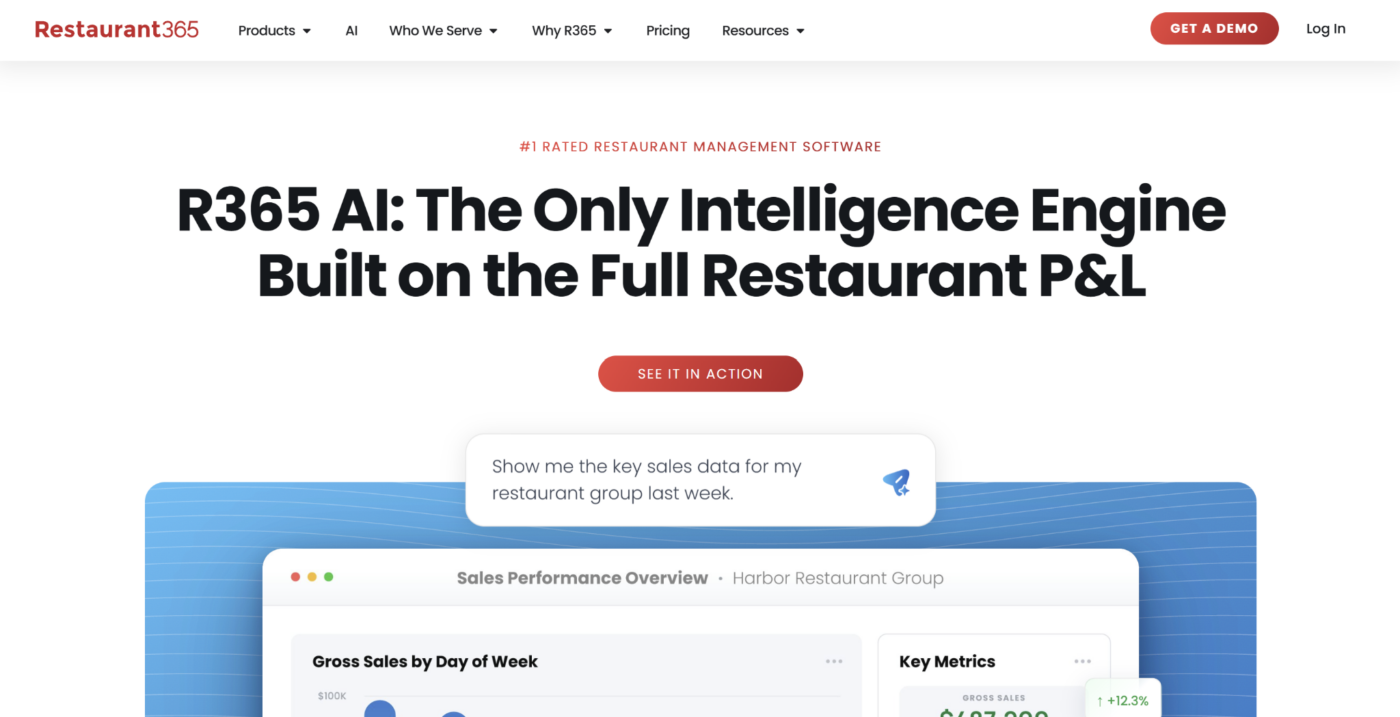
Restaurant365 combines restaurant accounting, inventory, scheduling, workforce tools, and reporting in one platform. Its analytics are particularly strong for finance and operations teams that want restaurant-specific P&Ls, cost reporting, and cross-location profitability insights.
Key Features
- Financial Reporting: It provides live P&Ls, balance sheets, flash reports, budgets, and customizable financial reports by restaurant or group. Users can drill from high-level performance into individual expenses and transactions.
- Cost and Profitability Analysis: It tracks food and labor costs, actual versus theoretical performance, menu profitability, and item costs across locations. Restaurant-specific reports help operators identify where margins are moving and why.
- Restaurant Data Integrations: It connects POS, vendors, banks, accounting, inventory, and workforce data inside one restaurant-focused system. This helps finance teams reduce manual consolidation across multiple restaurants and systems.
Pricing
| Plan | Pricing |
|---|---|
| All tiers | Custom |
Where Restaurant365 Shines
- Deep financial visibility: Restaurant-specific accounting and operational data sit together, making it easier to connect P&L performance with food, labor, purchasing, and location activity.
- Strong fit for multi-unit finance teams: Operators can compare locations, drill into individual expenses, and build custom reporting for different stakeholders.
- Broad restaurant back-office coverage: Accounting, inventory, scheduling, and reporting reduce the need to combine several separate back-office systems.
Where Restaurant365 Falls Short
- More implementation than a narrow analytics tool: Configuring accounting, integrations, locations, and historical data can require significant setup.
- Financial depth may be excessive for simpler use cases: A restaurant that only wants a lightweight sales or operational dashboard may not need the wider R365 platform.
Customer Reviews
“I like Restaurant365 for its detailed reporting and accurate inventory management.” – Eddie G.
“Level 2 support. R365 Payments and support. I’ve been trying to be able to setup for several months.” – Ramon S.
Who Restaurant365 Is Best For
- Multi-location restaurant finance teams: Controllers, CFOs, and operators that need detailed P&L, cost, inventory, and profitability reporting.
- Restaurants consolidating back-office systems: Groups that want accounting, operations, and restaurant analytics inside one platform.
3. MarginEdge: Best for Food-Cost and Purchasing Analytics
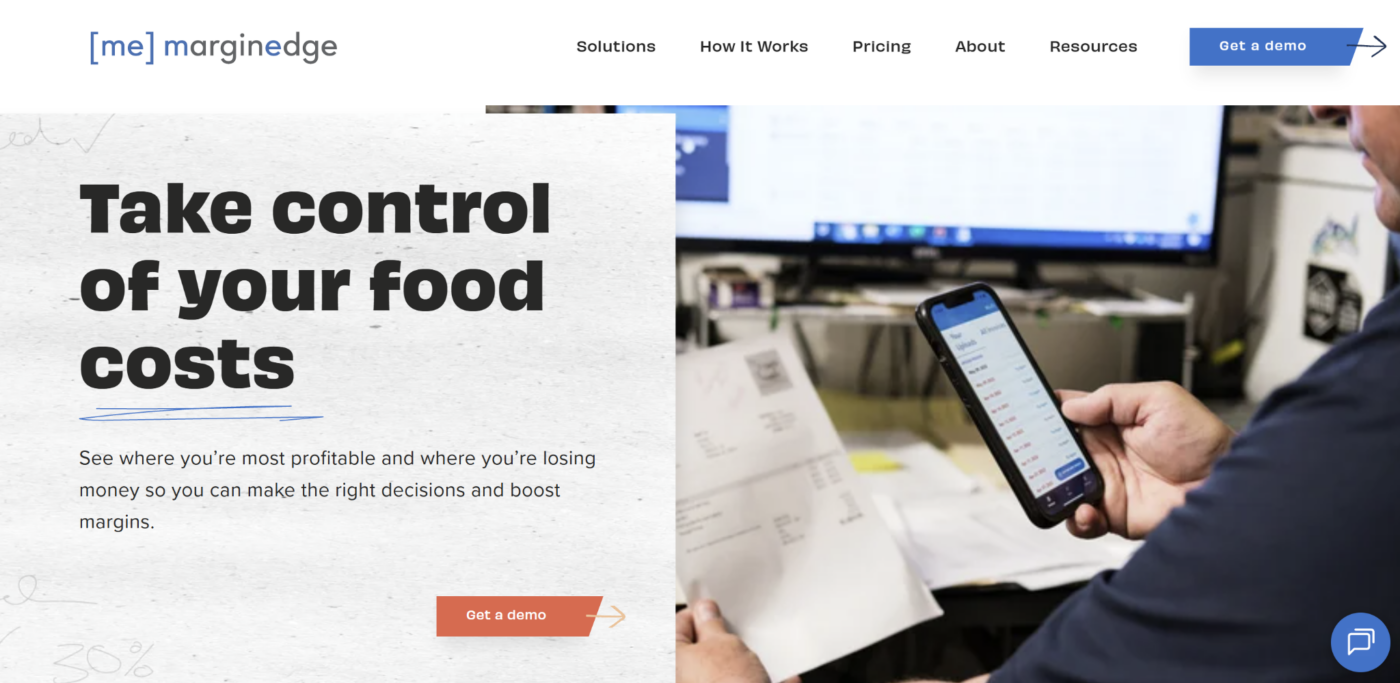
MarginEdge focuses on restaurant back-office costs. It combines invoice processing, POS data, inventory, recipes, purchasing, and budget information to give operators a more current view of food costs and controllable expenses.
Key Features
- Daily Controllable P&L: It combines POS sales and invoice data to show sales, spending, COGS, labor, and budget performance throughout the accounting period. This helps managers spot cost problems before waiting for month-end reporting.
- Actual vs. Theoretical Food Cost: MarginEdge compares expected ingredient usage based on sales and recipes with actual inventory consumption. It’s useful for finding waste, portioning problems, theft, or other unexplained food-cost variance.
- Menu and Ingredient Cost Analysis: It tracks changing vendor prices, recipe costs, menu margins, and product pricing across locations. Operators can identify ingredients or menu items whose economics have changed before margins deteriorate further.
Pricing
| Plan | Pricing |
|---|---|
| MarginEdge | $350/location/month |
| MarginEdge + Freepour | $500/location/month |
Where MarginEdge Shines
- Excellent food-cost visibility: Invoice, recipe, inventory, and POS data combine to show how changing ingredient prices affect restaurant margins.
- Straightforward pricing: The standard restaurant platform uses a flat per-location price rather than a long list of feature tiers.
- Strong multi-unit cost comparison: Operators can compare product prices and spending between locations to identify purchasing inconsistencies.
Where MarginEdge Falls Short
- Analytics focus heavily on back-office costs: It provides less depth for frontline audits, training, safety, or operational compliance.
- Good reporting depends on clean setup and data: Recipes, inventory items, invoices, and POS mappings need to be maintained accurately for the strongest insights.
Customer Reviews
“The most helpful for me is pricing information and food cost. Taking in inventory is a breeze so easy to go back in correct and find the problems.” – Brian M.
“The mobile application lacks a lot so it requires you to log into the website for most of the functionality. A few of the features are complex and take a little time to get used to.” – Ryan H.
Who MarginEdge Is Best For
- Restaurants focused on food-cost control: Operators that want to monitor ingredients, recipes, purchasing, inventory, and controllable expenses closely.
- Multi-unit groups comparing supplier costs: Teams that need to see whether locations are paying different prices for the same products.
4. 7shifts: Best for Labor and Workforce Analytics
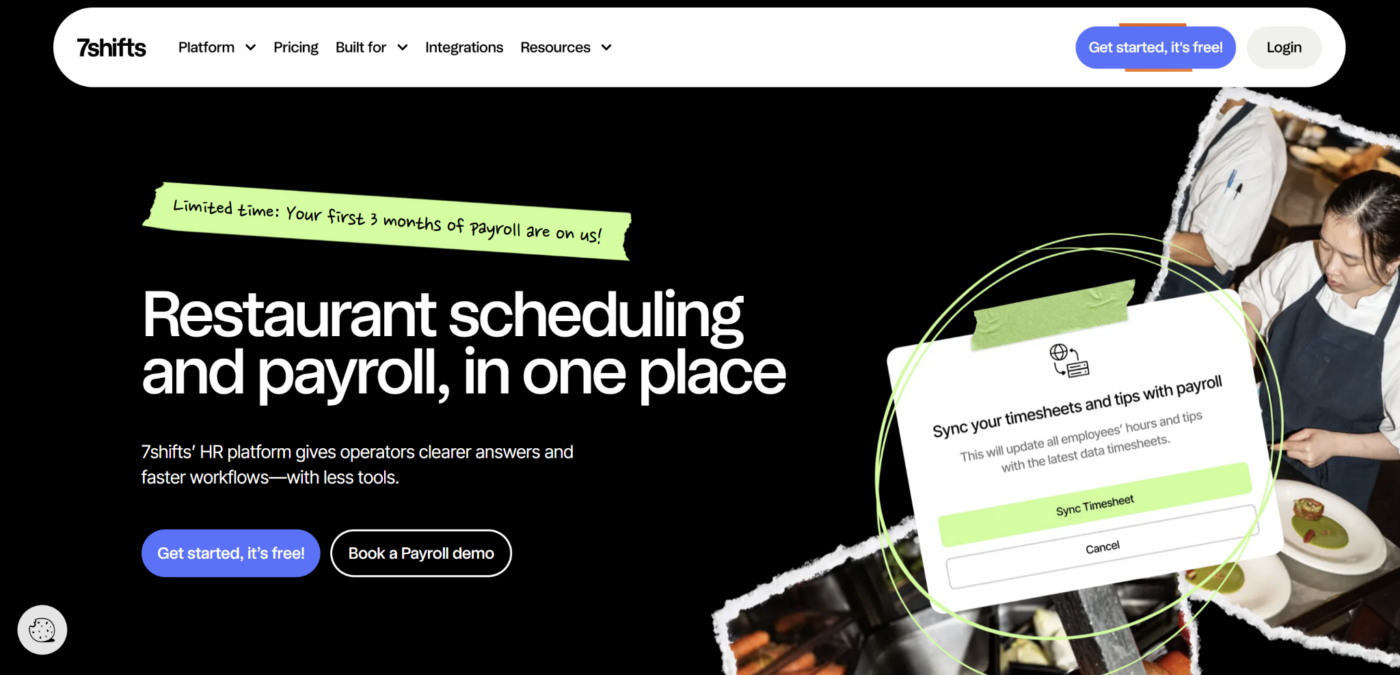
7shifts is a restaurant workforce platform centered on scheduling, labor management, communication, and employee operations. Its analytics are strongest when operators want to understand whether staffing levels and labor costs match restaurant demand.
Key Features
- Sales and Labor Reporting: POS integrations connect actual sales, worked hours, wages, and scheduling information for restaurant labor reporting. Managers can review labor performance alongside the sales activity driving staffing demand.
- Labor Forecasting: Sales projections and labor-budget tools help managers plan schedules around expected demand before shifts are published. Higher plans add advanced hourly forecasting and labor recommendations.
- Workforce and Manager Insights: Reporting sits alongside scheduling, attendance, time clocking, manager logs, and team communication. This gives operators a broader view of labor execution rather than treating workforce analytics as a standalone report.
Pricing
| Plan | Pricing |
|---|---|
| Comp | Free |
| Essentials | $39.99/location/month, billed annually |
| Pro | $79.99/location/month, billed annually |
| Premium | $134.99/location/month, billed annually |
Where Nory Shines
- Real-time prime-cost visibility: Restaurants can monitor sales, GP, and labor during the trading period instead of waiting for historical P&Ls.
- Forecasting feeds operational decisions: Demand forecasts can inform schedules, ordering, and inventory rather than remaining isolated inside a dashboard.
- Designed for multi-site restaurant groups: Group-level and location-level reporting make it easier to compare performance between restaurants.
Where Nory Falls Short
- More platform than a simple analytics buyer may need: Nory also covers workforce, inventory, payroll, forecasting, and other restaurant operations.
- Best fit is restaurant-style operations: Businesses with materially different workflows, such as some bakeries or non-restaurant food businesses, may find the restaurant-centric design less suitable.
Customer Reviews
“It is highly flexible, especially in regards to generating Stock reports. Adaptable depending on what information you wish to see.” - Bran L.
“I wish it was easier to use on my laptop and get all the same features than on the iOS app.” - Lucy M.
Who Nory Is Best For
- Multi-site restaurant groups managing prime cost: Operators that want labor, food cost, sales, and forecasting connected in one platform.
- Restaurants ready to use AI-driven planning: Groups that want forecasts to feed scheduling, ordering, and other operating decisions rather than using analytics only for historical review.
6. Tenzo: Best for Cross-System Restaurant Business Intelligence
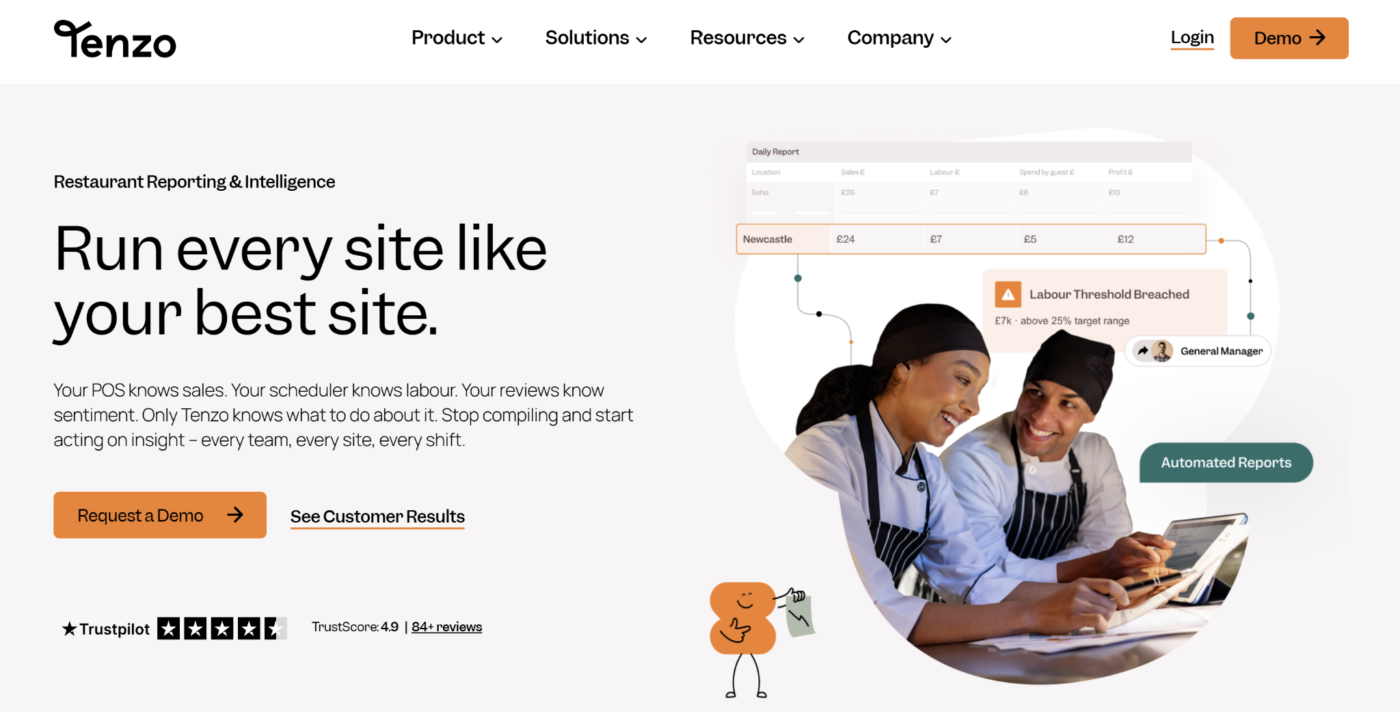
Tenzo is built for restaurant groups that already use several specialist systems and want one analytics layer across them.
It brings data from POS, labor, inventory, reservations, reviews, and other restaurant tools into a shared reporting environment. Teams can build custom dashboards, compare locations, automate reports, forecast demand, and send scorecards or alerts to managers.
Tenzo is particularly useful when the problem is fragmented data rather than a lack of restaurant software. Pricing starts at $75 per location/month and increases according to the modules and locations selected.
7. Toast: Best for POS-Native Sales Analytics
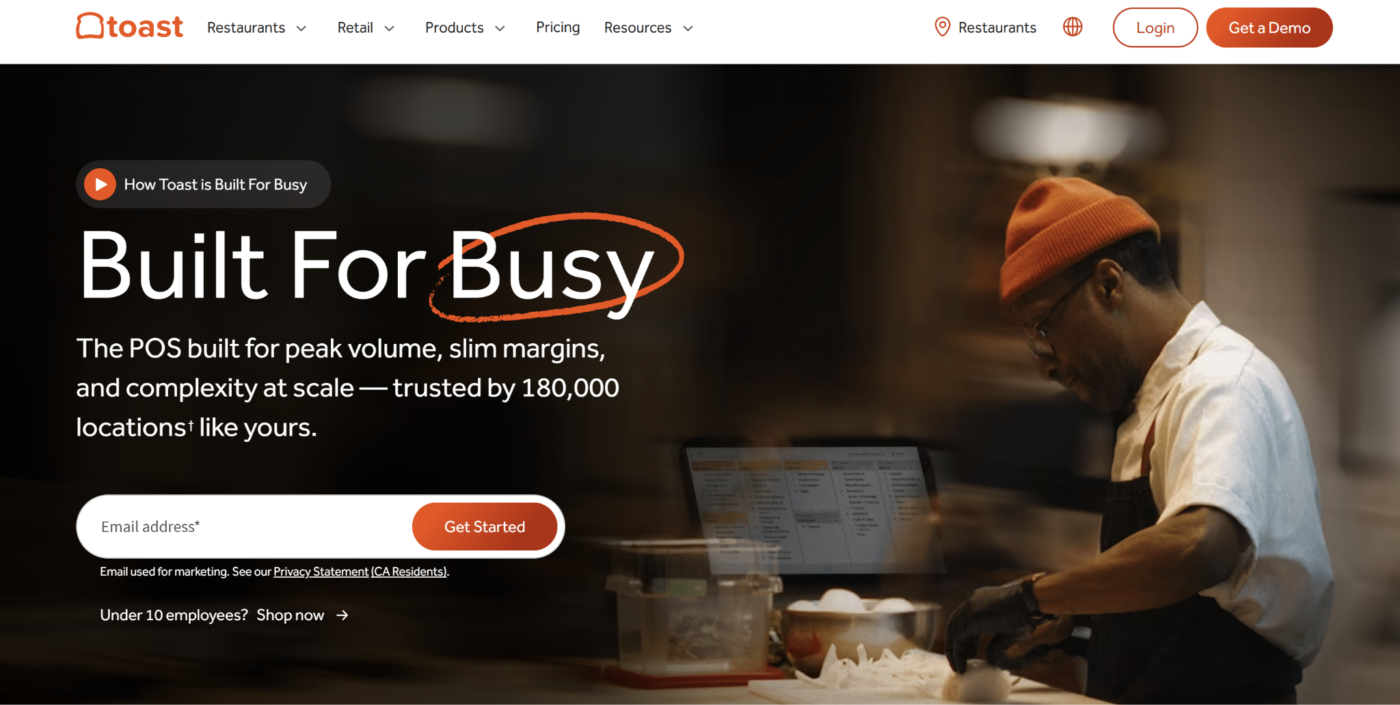
Toast is a restaurant POS platform with reporting built around the transactions already flowing through its ecosystem.
Operators can analyze sales, menu performance, labor, dayparts, ordering channels, and location performance without adding a separate restaurant business intelligence platform. Its cloud-based reporting also makes restaurant data accessible away from the site.
Toast is strongest when the restaurant already runs on Toast and sales analytics are the priority. It is less suitable as an independent BI layer for operators trying to consolidate a mixed technology stack.
Toast’s Point of Sale package currently starts at $69/month, with larger configurations priced separately.
8. Crunchtime: Best for Enterprise Multi-Unit Operational Intelligence
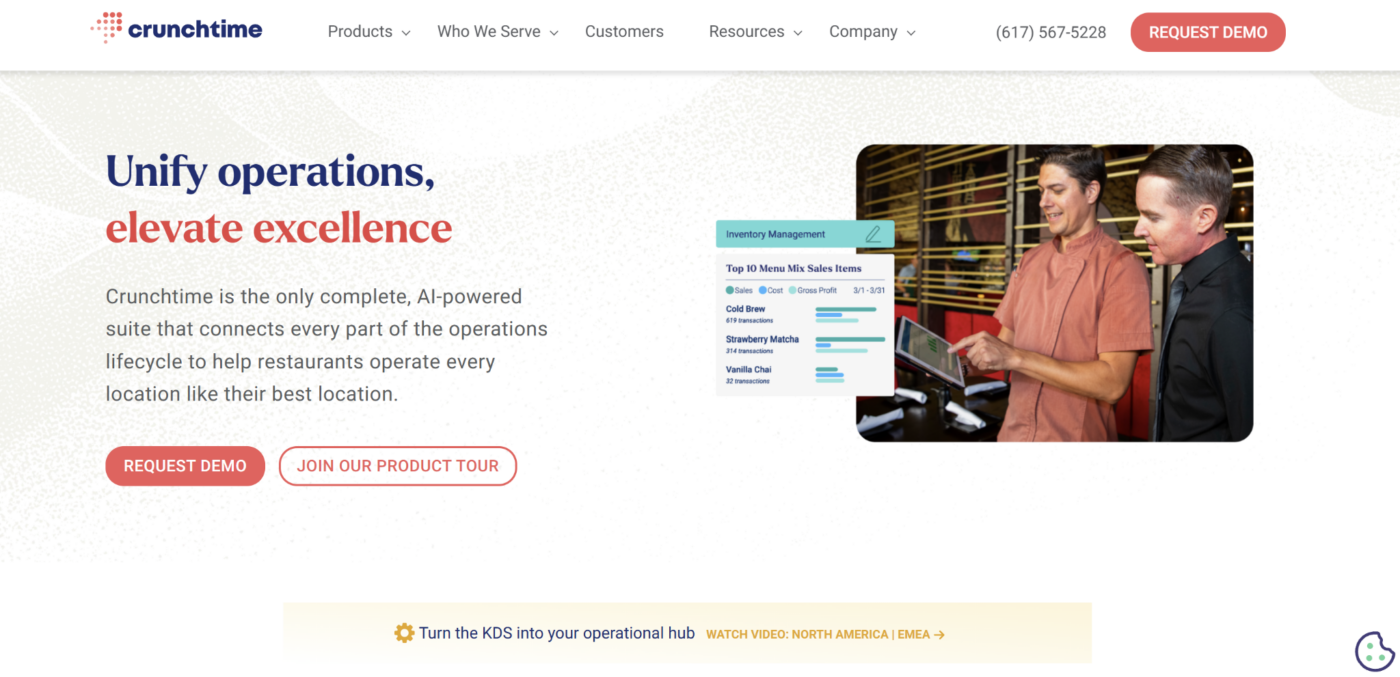
Crunchtime is an enterprise restaurant operations suite covering inventory, labor, kitchen management, operational execution, and analytics.
Crunchtime Insights brings data from sales, inventory, labor, POS, tasks, and other operational workflows into visual dashboards. Restaurant groups can compare locations, identify top and lower-performing stores, and give corporate, above-store, and location teams different reporting views.
Its wider suite makes Crunchtime particularly well suited to large restaurant brands that want analytics connected to multiple areas of restaurant operations. Pricing is available on request.
How to Choose a Restaurant Analytics Software
Start with the decisions you want the data to improve. A powerful analytics platform is still a poor fit if it analyzes the wrong part of your restaurant operation.
1. Decide What Type of Analytics You Actually Need
Different tools answer different questions.
If food cost is the problem, prioritize inventory, recipes, purchasing, and actual-versus-theoretical reporting. If labor is the issue, look for scheduling, wage, productivity, and forecasting data. For finance, focus on P&L and accounting visibility.
Operational analytics answer another question: Are locations actually executing the standards behind performance?
Operandio is strongest in this lane, giving multi-location teams visibility into tasks, inspections, training, incidents, safety, and compliance alongside broader restaurant analytics and reporting.
2. Check Where the Data Comes From
Before comparing dashboards, identify the systems producing the underlying data.
Useful restaurant analytics may come from:
- POS transactions
- Scheduling and labor systems
- Inventory and purchasing
- Accounting
- Reservations
- Customer feedback
- Tasks and checklists
- Audits
- Training
- Incidents and compliance records
Some platforms generate this data themselves. Others act as an aggregation layer across existing tools.
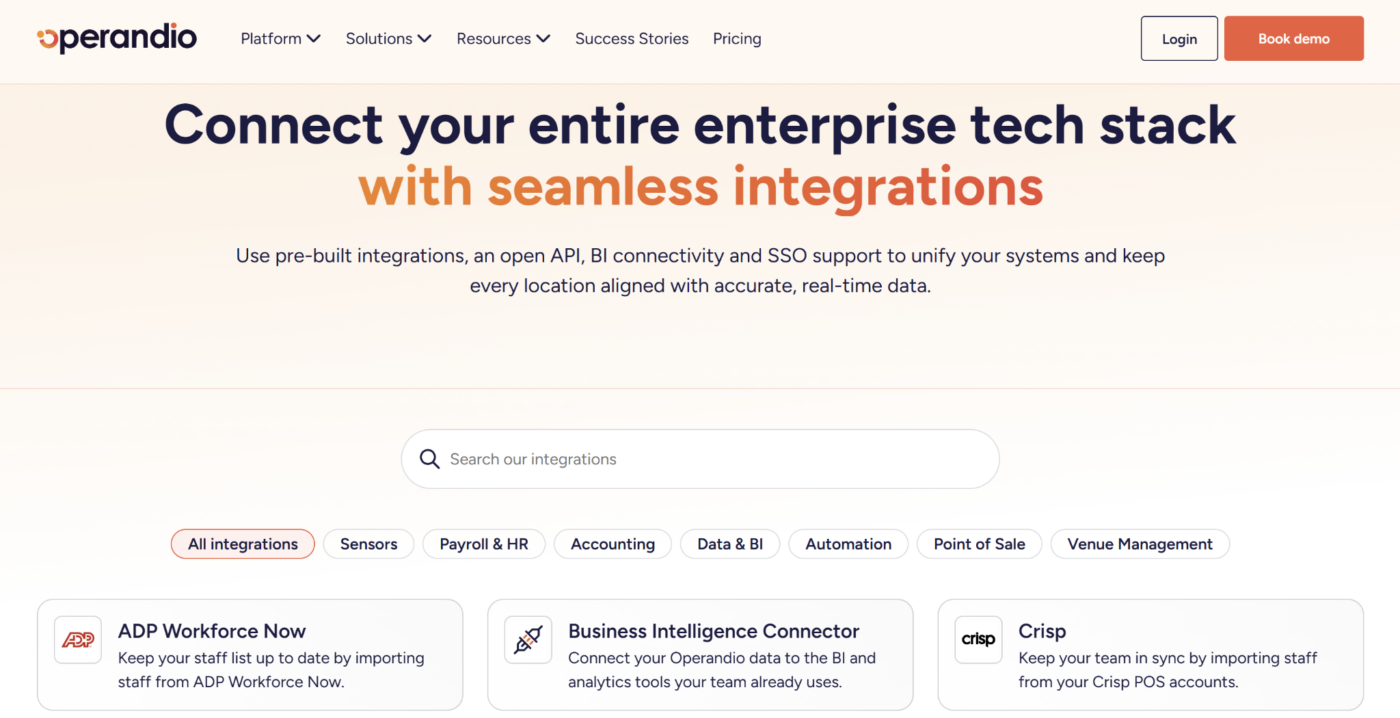
If you already have a mature technology stack, prioritize integrations, APIs, exports, and BI connectivity instead of replacing working systems purely to consolidate reporting.
3. Compare Single-Location and Multi-Location Reporting
A single restaurant may only need daily sales, food cost, labor percentage, and basic trend reporting.
Restaurant groups need more structure:
- Location comparisons
- Regional rollups
- Brand or concept filters
- Role-based access
- Network benchmarks
- Drill-down from group to location
Good franchise analytics should let head office see the network while giving location and area managers only the data relevant to them.
Operandio follows this model with separate location, territory, and network-level reporting views.
4. Look for Real-Time Exceptions, Not Only Historical Reports
Historical reporting tells you what happened. Operational teams also need to know what requires attention now.
Ask whether the platform can quickly surface:
- Missed tasks
- Failed audits
- Unusual labor or food-cost variance
- Incidents
- Compliance gaps
- Underperforming locations
The faster managers can isolate the exception, the faster they can investigate the cause.
Operandio’s operational dashboards help restaurant groups identify gaps in execution while work is happening rather than waiting for individual managers to summarize them later.
5. Make Sure Managers Can Understand the Data
More reports do not automatically produce better decisions.
Restaurant managers should be able to answer:
What requires my attention, and what should I do next?
Look for clear filters, saved views, mobile access, scheduled reports, drill-down capability, and dashboards appropriate to the user’s role.
A restaurant GM may need location-level exceptions, while an operations director needs comparative trends across the network.
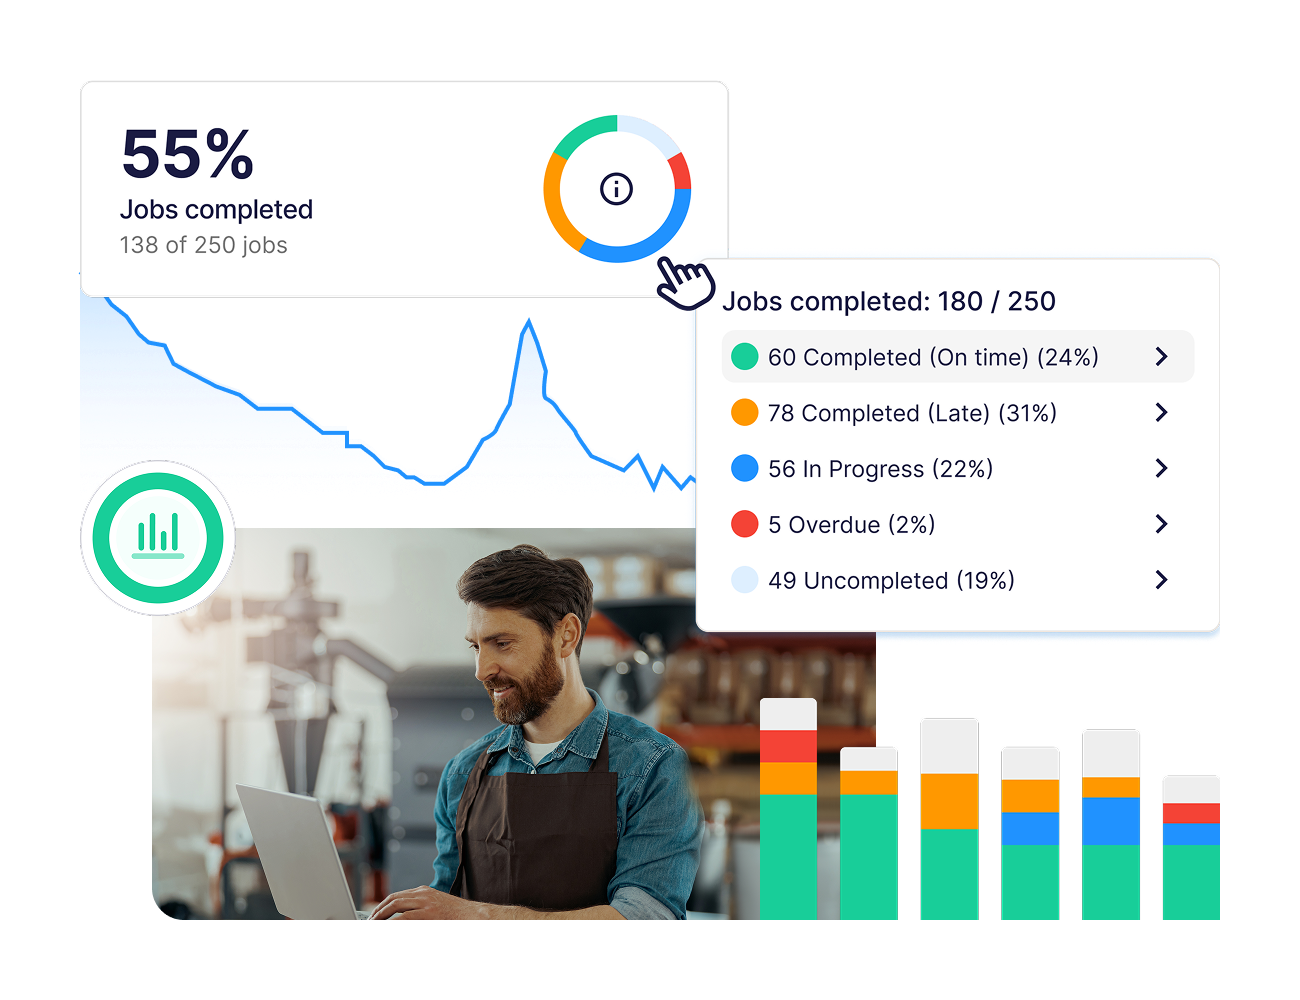
Choose software that gives each user enough context to act without requiring every manager to become a data analyst.
6. Check How the Platform Fits Your Existing Tech Stack
Restaurant analytics software can take several forms:
- A POS with native reporting
- A restaurant accounting platform
- A workforce-management system
- A dedicated BI layer
- An operational platform
The right choice may complement your current systems rather than replace them.
Operandio, for example, can send operational data into Power BI or Tableau so restaurant groups can combine frontline execution with financial, sales, HR, or other business data.
That approach is useful when your POS already answers what sold, but you still need visibility into how each location is operating.
Get a Complete View Into Your Operational Suite With Operandio
Restaurant performance is easier to understand when you can see the work behind the numbers.
Operandio gives multi-location teams real-time reporting across tasks, audits, training, incidents, safety, and compliance while letting head office compare performance across locations, regions, and brands.
Its operational data can also feed into wider BI environments alongside sales and financial information, so you do not need to replace specialist restaurant systems to improve visibility.
If you want restaurant analytics connected directly to frontline execution, request a demo.
FAQs
What is restaurant analytics software?
Restaurant analytics software collects and analyzes restaurant data so operators can track performance, identify trends, compare locations, and make better operating decisions.
Should restaurant owners actually care about analytics?
Yes. Analytics can expose changes in sales, costs, labor, execution, and compliance before they become larger operational or financial problems.
How do restaurant owners track business analytics?
Usually through POS, labor, inventory, accounting, operations, or BI software that turns restaurant data into dashboards, reports, trends, and alerts.
What metrics should restaurant analytics software track?
It depends. Common metrics include sales, labor cost, food cost, margins, task completion, audit scores, incidents, training, and location performance.
What is the difference between restaurant analytics and restaurant business intelligence?
Restaurant analytics examines performance data. Business intelligence typically combines multiple data sources into broader dashboards, comparisons, forecasting, and decision-support reporting.
Can restaurant analytics software compare multiple locations?
Yes. Multi-unit platforms can compare restaurants by location, region, concept, or brand and highlight sites that are above or below network benchmarks.